32 results
tagged
visualization
✕

"a visualization of global weather conditions forecast by supercomputers updated every three hours"
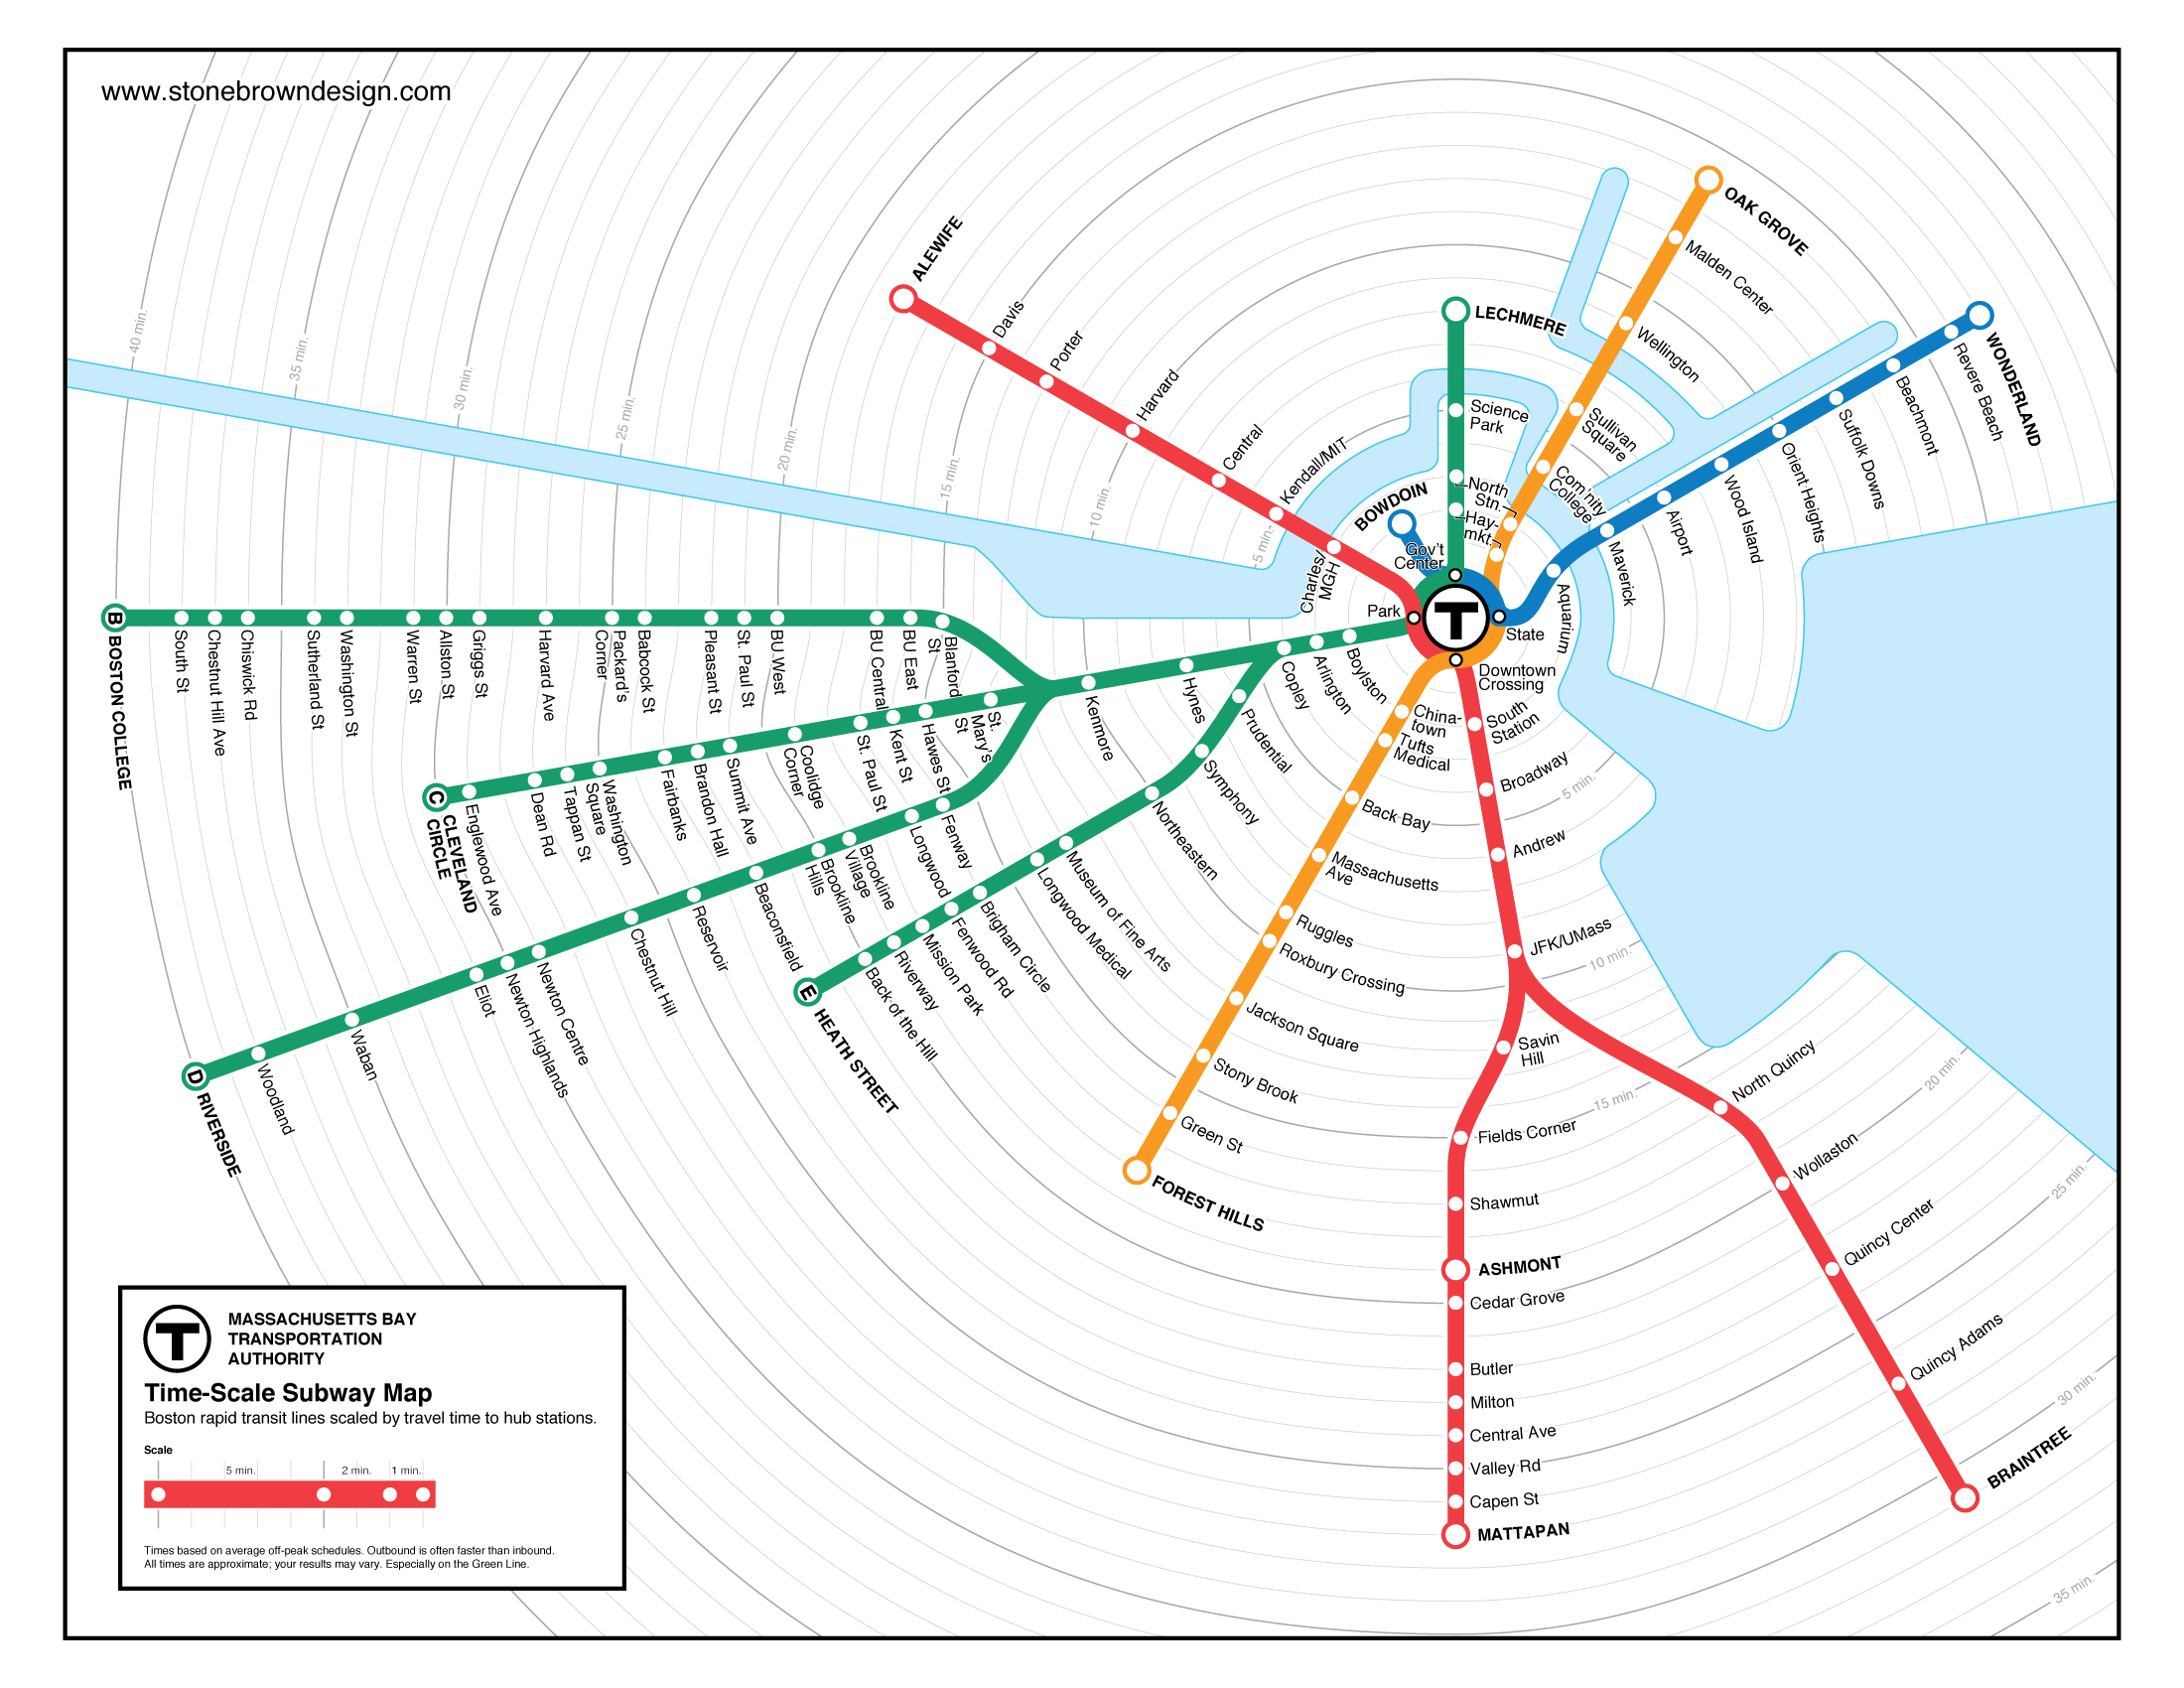
Map of the Boston T scaled by travel time
Visualize regular expressions. Very useful.
Illustrations representing the internet. Looks interesting.
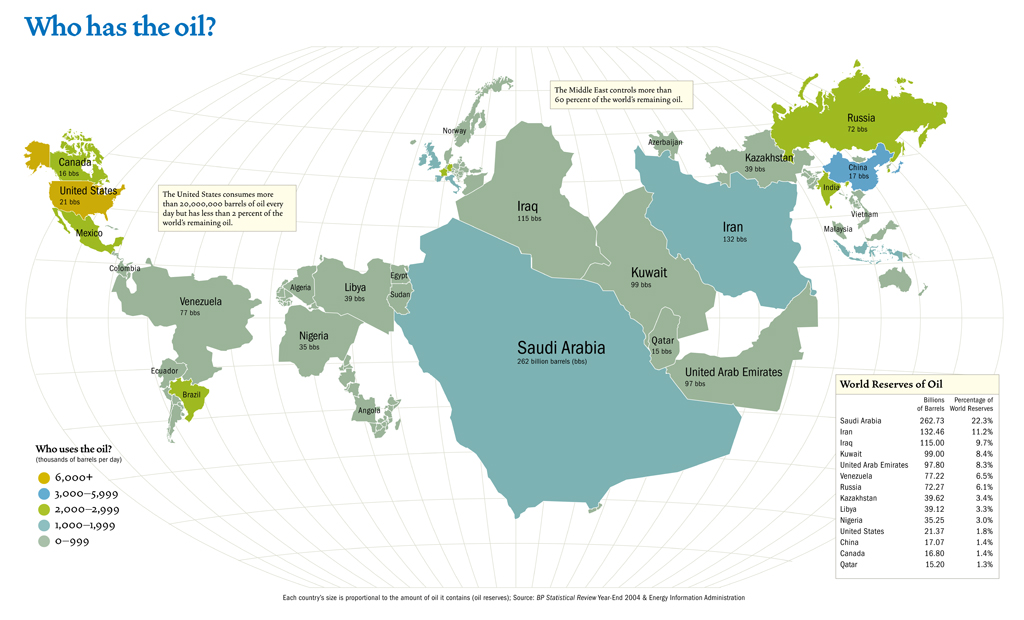
A map scaling countries by their oil production and coloring them by their usage.
Big, very usable chart showing candidates' stances on hot issues
Fantastic grid-based approach to visualizing percentages. This beats the pants off of pie charts.