9 results
tagged
information
✕

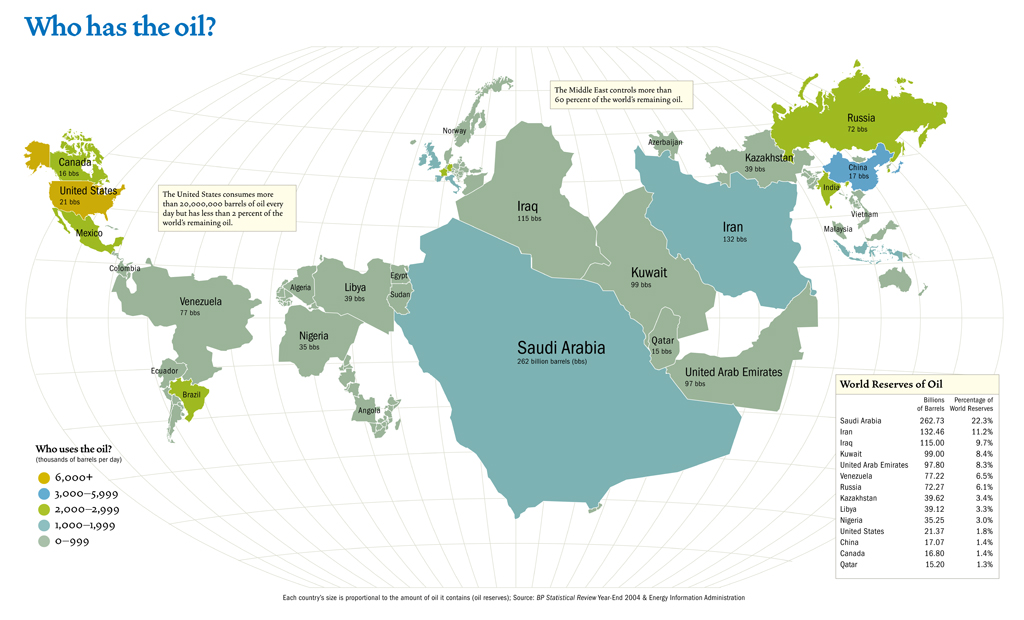
A map scaling countries by their oil production and coloring them by their usage.
Fantastic grid-based approach to visualizing percentages. This beats the pants off of pie charts.
Your Rights and Remedies When Stopped or Confronted for Photography
"a much-revised and extended draft of the sparkline chapter for Beautiful Evidence (2005)"